English

 Polski


Why is etalon effect (fringing) reduction important in spectroscopic devices
Etalon effect - also known as optical fringing - reduction is critical because it causes severe signal fluctuations and heavily degrades performance, remaining a key limiting factor in laser absorption spectroscopy [1,2].
Minimizing this effect is crucial to unlocking the full potential of optical spectroscopic techniques, which offer rapid and highly precise gas detection capabilities. Solving this problem is particularly urgent today, as the widespread availability of QCL and ICL sources accelerates the deployment of spectroscopic instruments in key areas like security, industrial control, environmental monitoring, and healthcare.
What optical fringing effect is?
Optical fringing is a result of the interference of radiation reflected on the optical elements. In photonic infrared detectors, the window and the chip are the components most critical to the formation of interference fringes. As radiation passes through them, the transition between media causes its energy to split, resulting in partial transmission and reflection (see Fig. 1). The co-propagating rays interfere with one another, and their optical path difference determines whether the interference is constructive or destructive, thereby amplifying or attenuating the signal. An example of signal fluctuations caused by fringing is illustrated in Fig. 2.
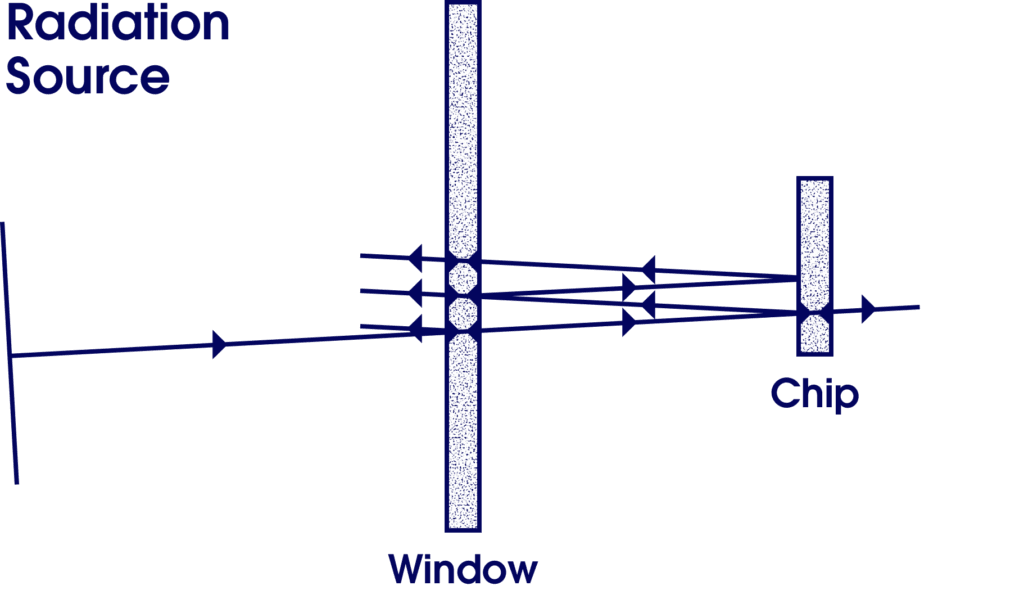
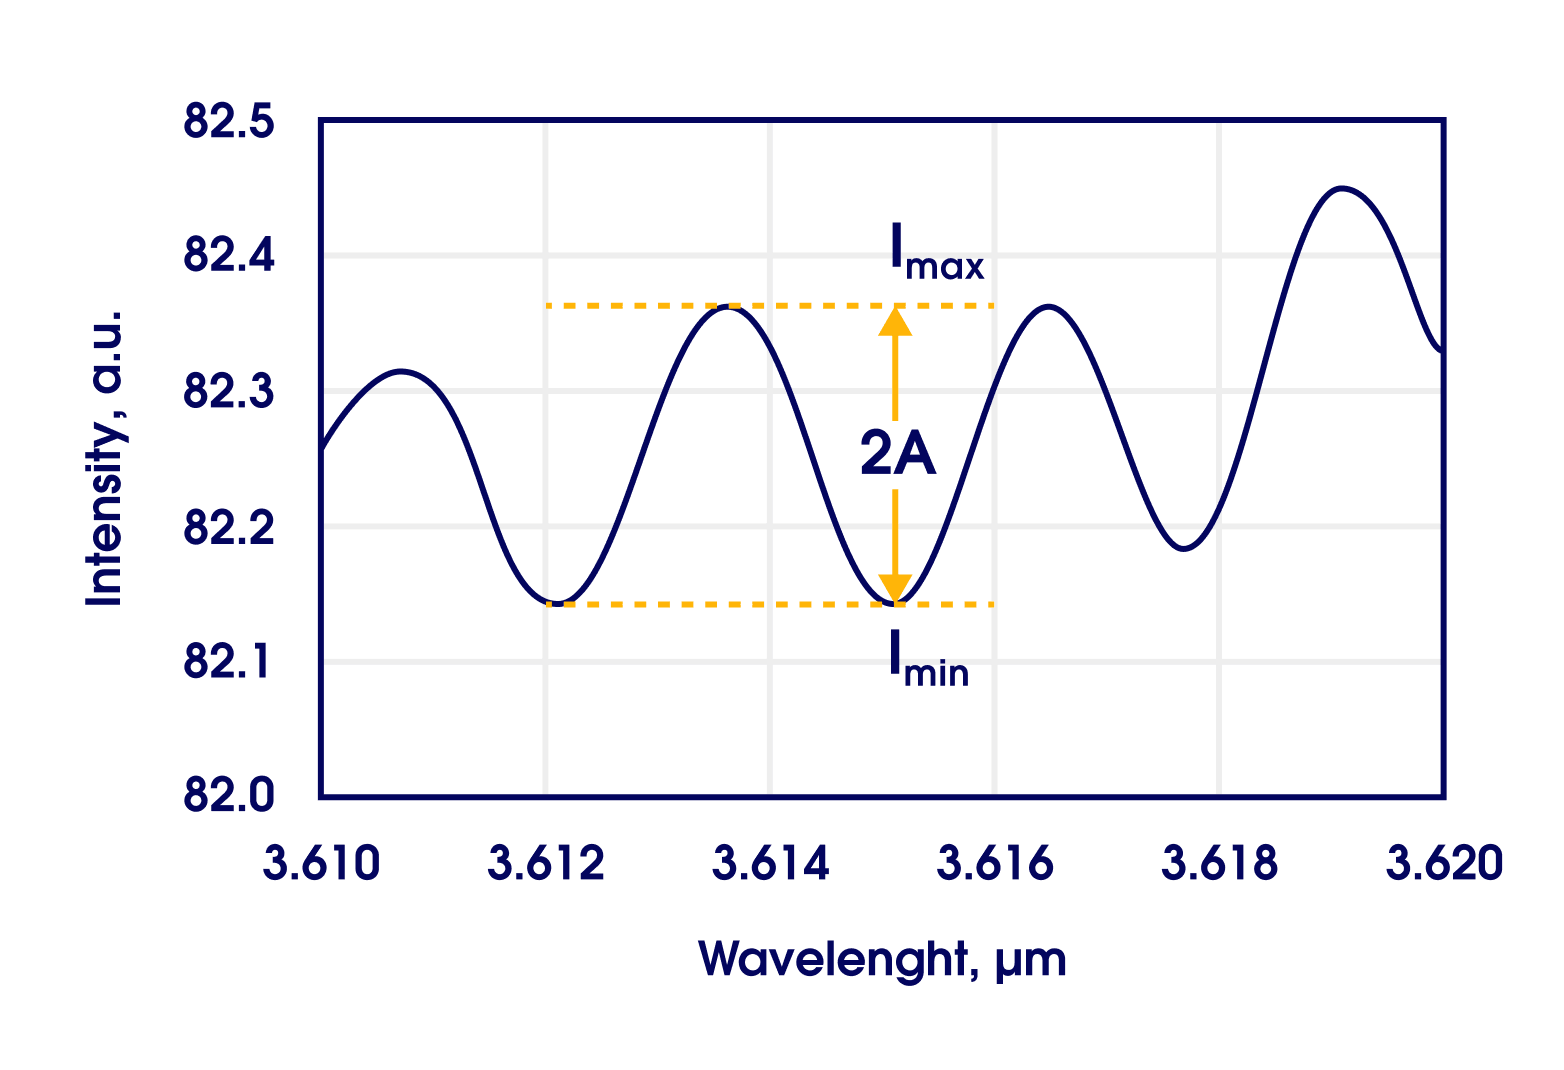
FIGURE 2. Illustration of optical fringing/etalon effect
A characteristic feature of etaloning is a periodic variation in the signal. The period of this sinusoidal modulation depends on the optical path length within the medium, while its amplitude is determined by the intensities of the transmitted and reflected rays [3]. Reflectivity at the interface of two media is defined by the equation:
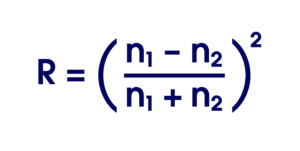
Material for the window should not absorb radiation. In the case of infrared detectors the most common materials are presented in the Tab. 1.
Common materials used in infrared detectors.
| Material | Refraction index | Reflectivity* [%] | Transmittance spectra [um] |
| Silicon | 3.4 | 29.75 | 0.8-6.5 |
| Germanium | 4.2 | 37.87 | 1.8-16 |
| ZnSe | 2.3 | 15.52 | 0.5-22 |
| GaAs | 3.3 | 28.61 | 0.8-18 |
| Sapphire | 1.7 | 6.72 | 0.2-5.5 |
*reflectivity at the material/air interface.
As can be seen, materials used in the infrared region exhibit quite high refractive indices, which result in high reflectance. This effect can be mitigated by antireflective coatings.
The amplitude of the interference fringes in infrared detectors increases significantly for radiation wavelength above peak wavelength. This is due to the weaker absorption of long wavelengths in the absorber, so that more radiation is reflected from the metallization of the detector structure, contributing to greater etalon effect (see FIGURE 3).
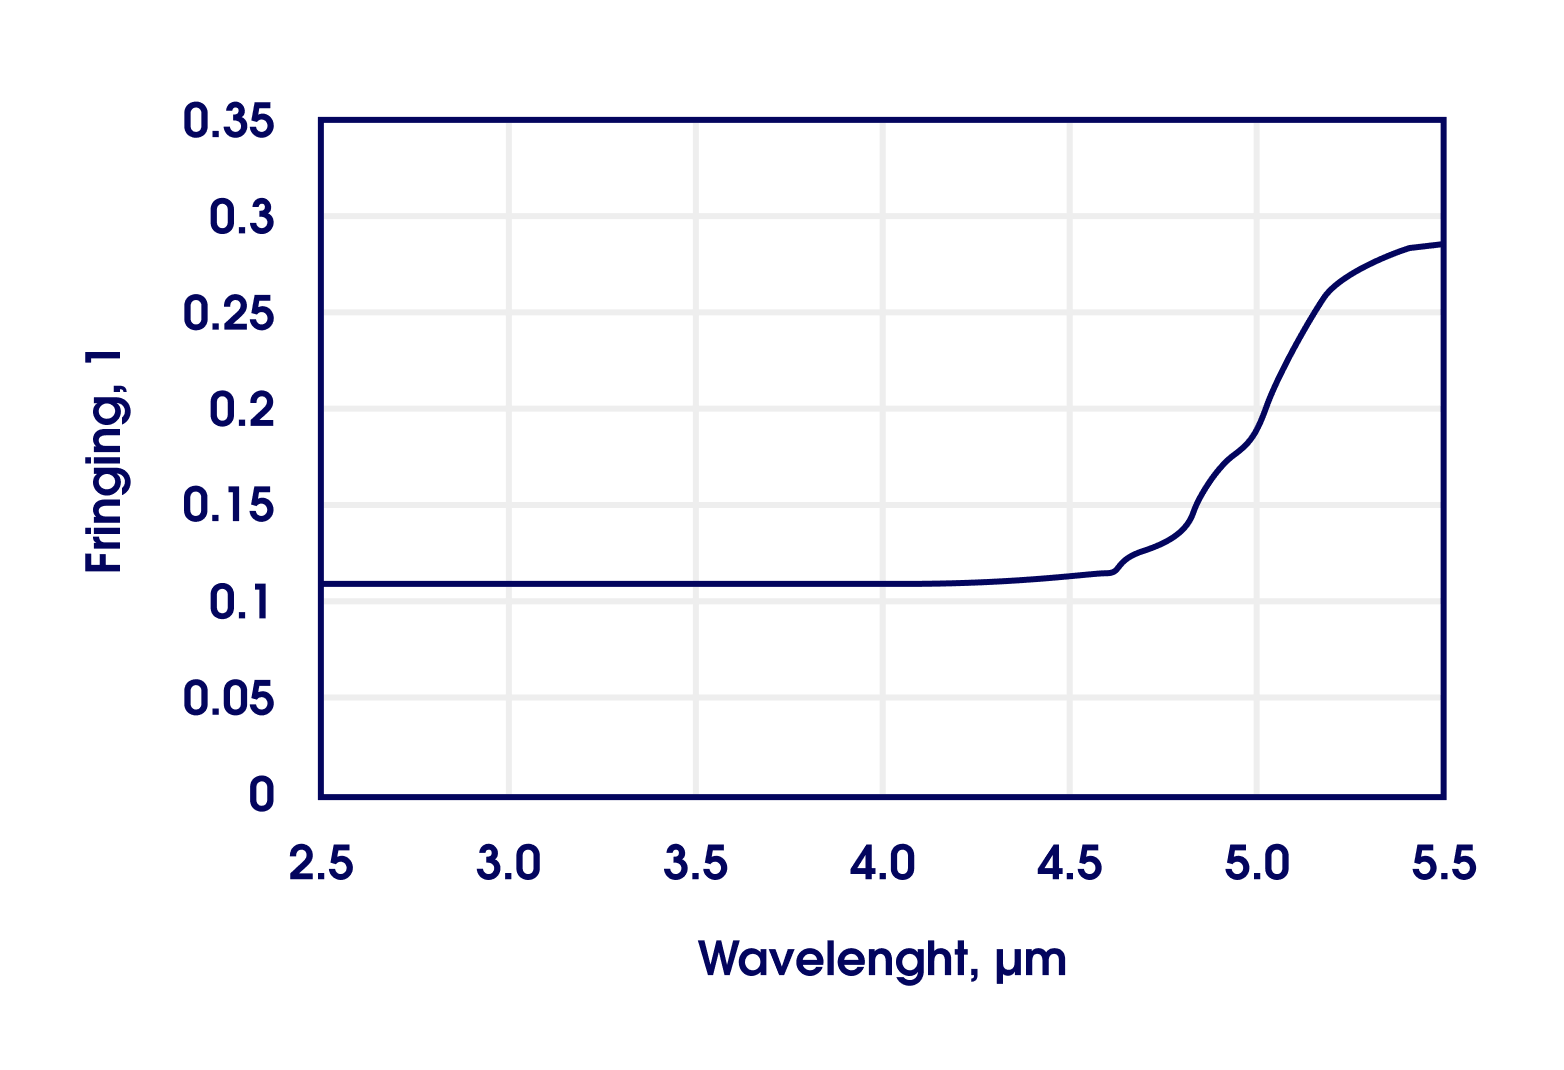
FIGURE 3. Theoretical calculations of fringing vs. wavelength in MWIR standard IR detector illuminated by coherent radiation
How anti-fringing technology work?
VIGO anti-fringing technology means internal modification of the detector structure. After the growth the wafer is characterized and specially processed to manufacture detection structures immune to the generating of interference fringes. This results in the fringing 10 – 40 times smaller compared to the standard IR detector (see FIGURE 4, FIGURE 5, FIGURE 6 and FIGURE 7).
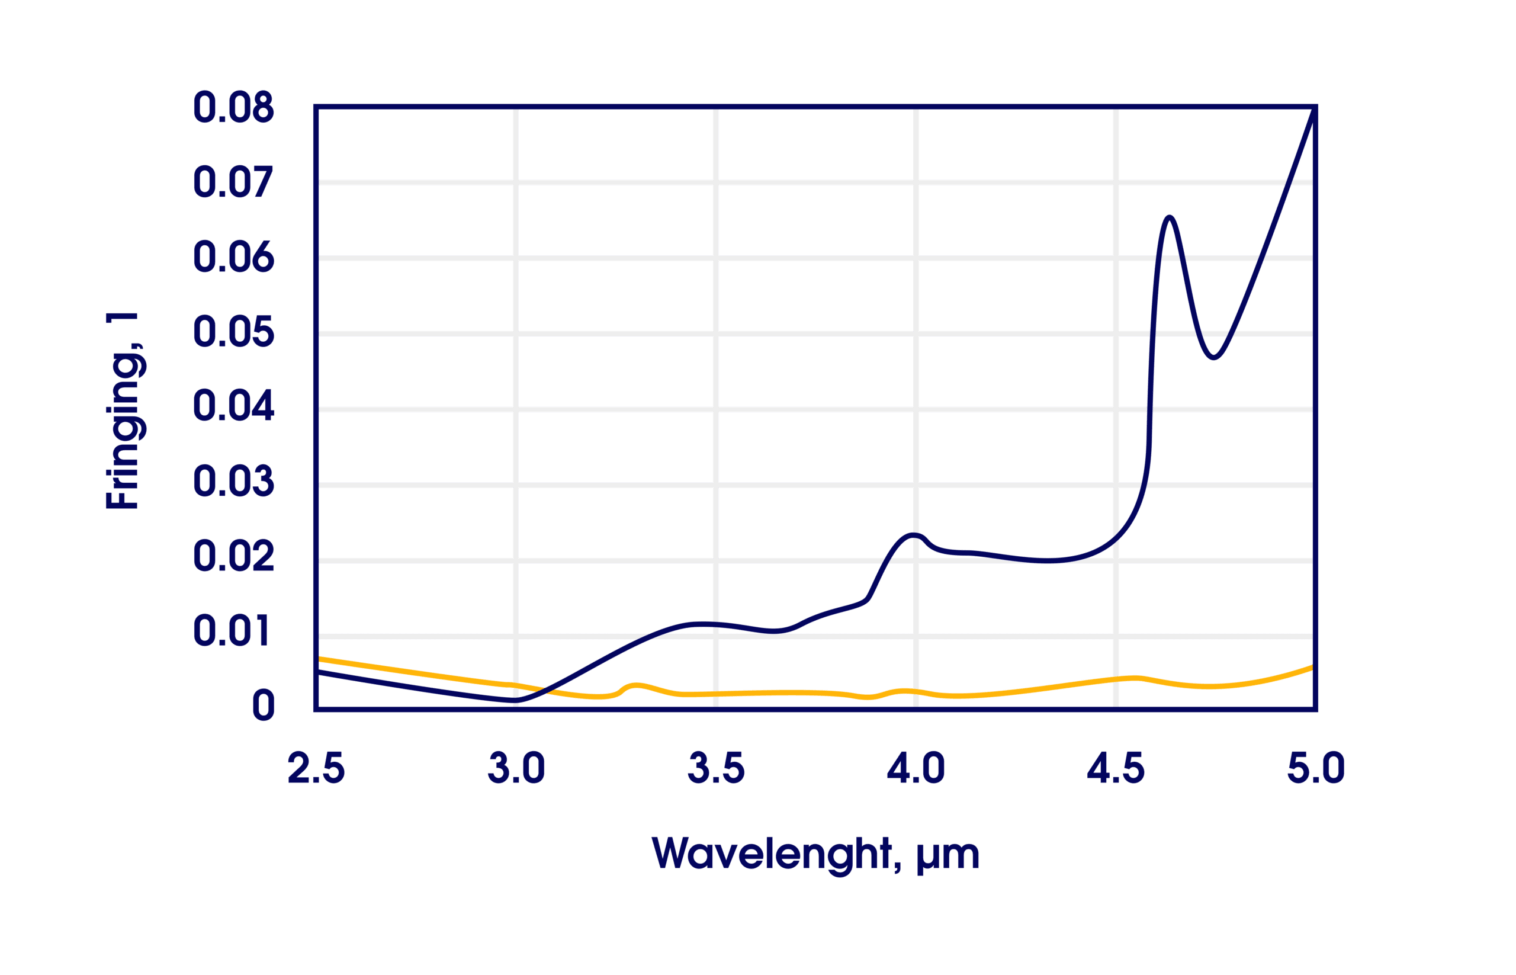
FIGURE 4. Fringing in an exemplary MWIR standard detector (dark blue line) and detector with anti-fringing technology applied (orange line)
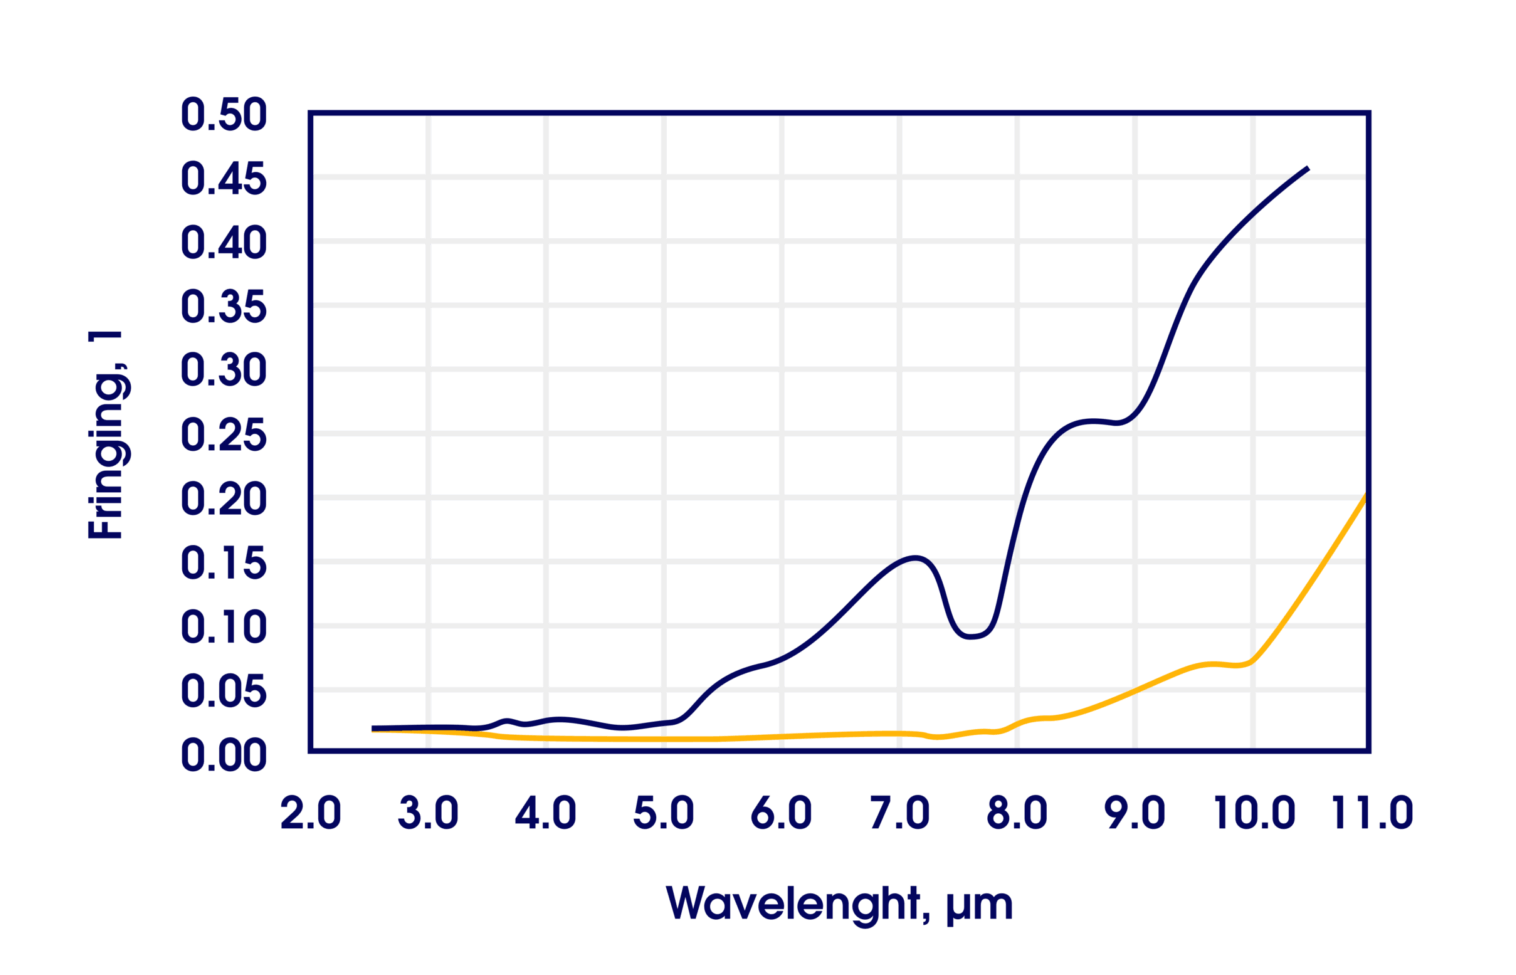
FIGURE 5. Optical fringing in an exemplary LWIR standard detector (dark blue line) and detector with anti-fringing technology (orange line)
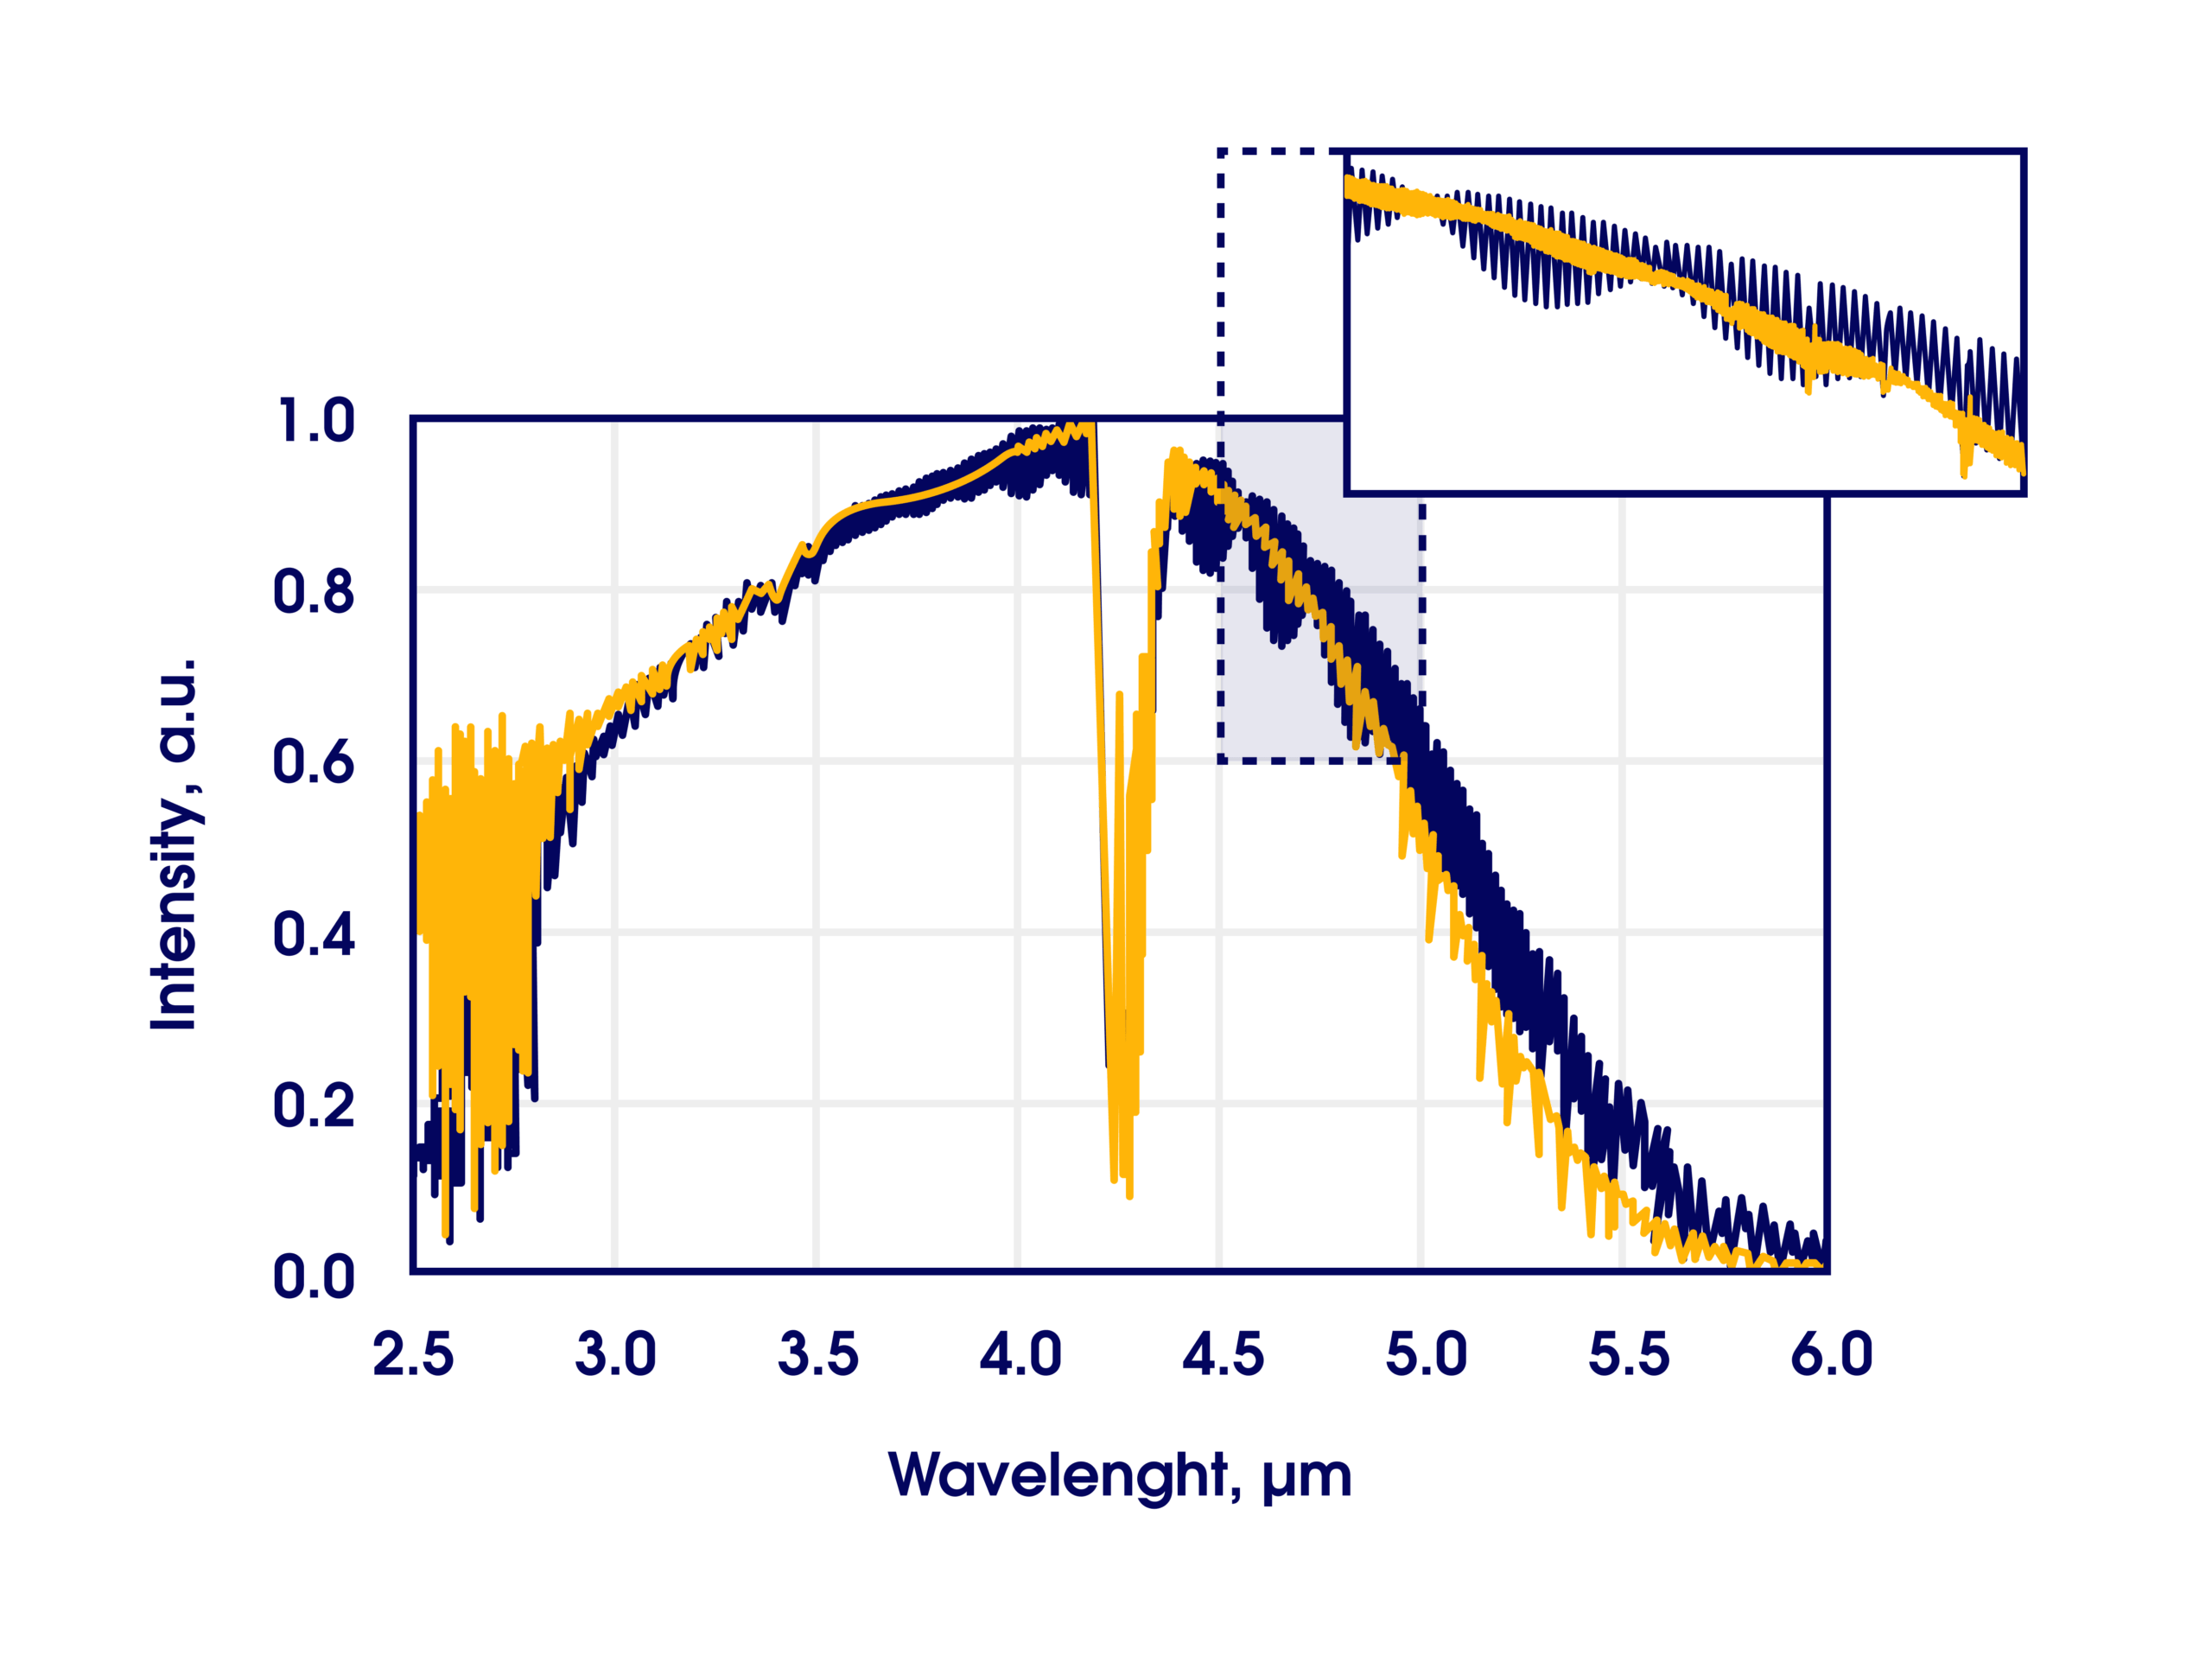
FIGURE 6. Normalized spectral characteristics of an exemplary MWIR standard detector (dark blue line) and detector with anti-fringing technology applied (orange line)
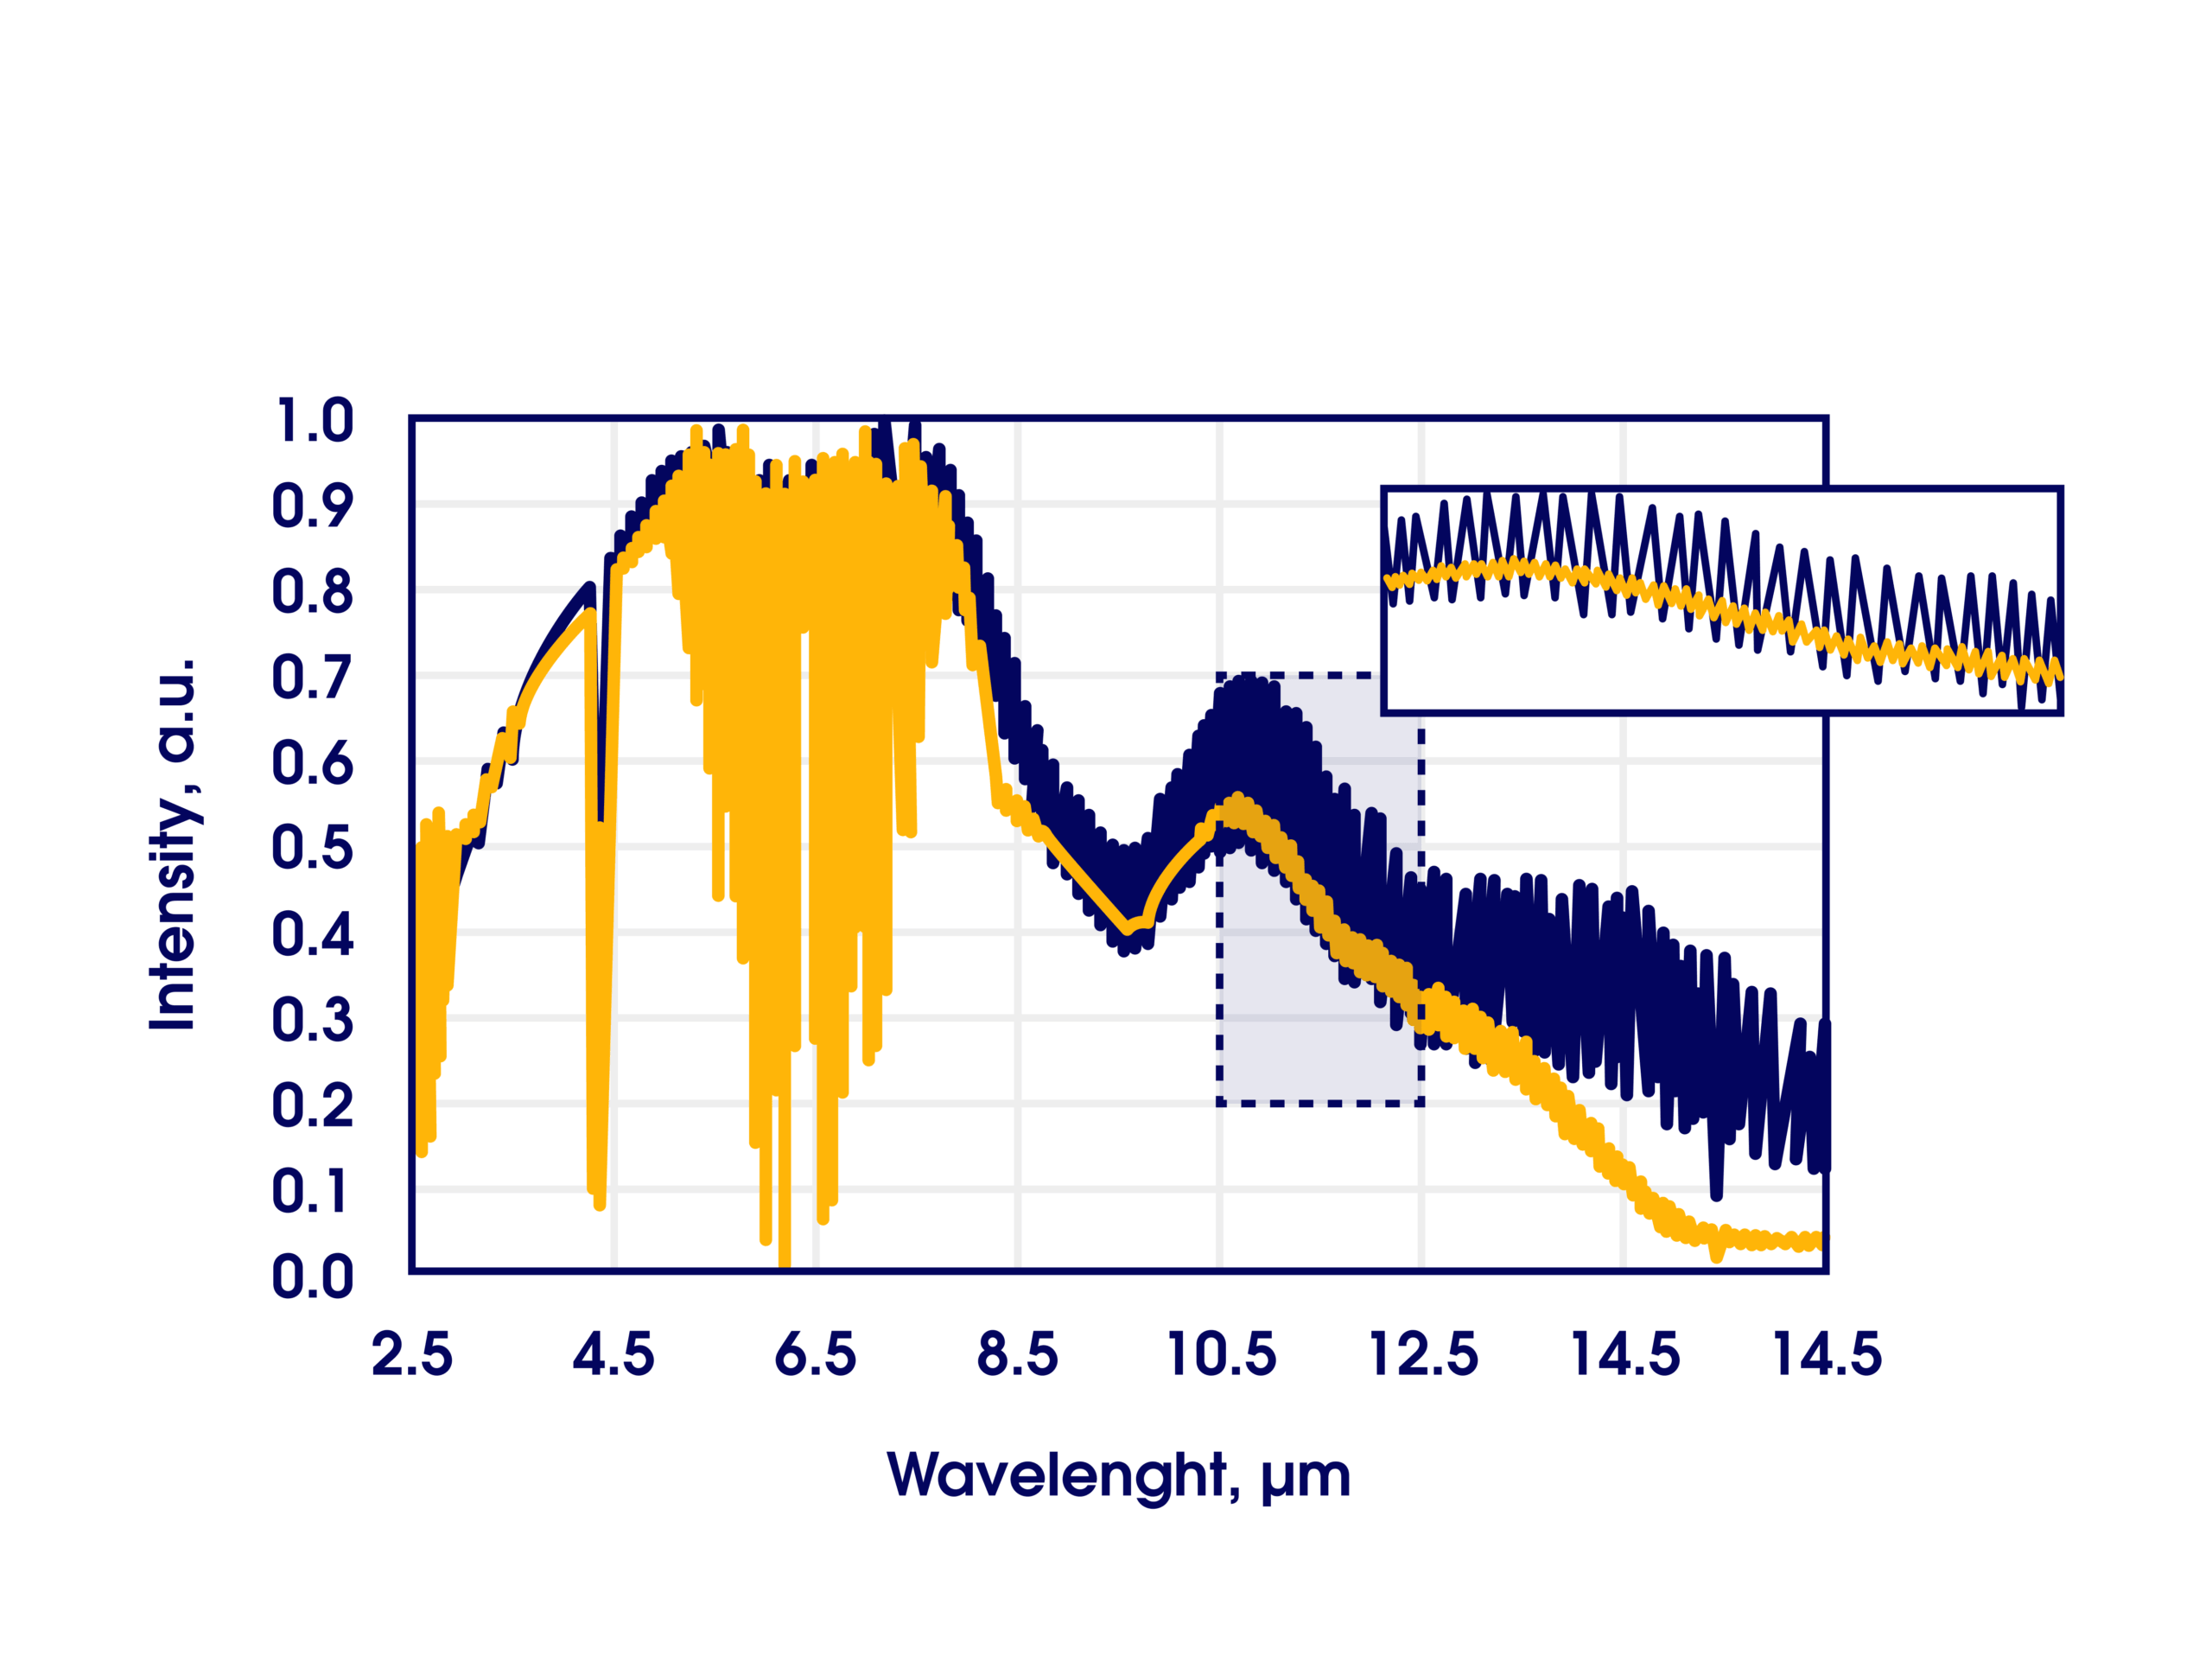
FIGURE 7. Normalized spectral characteristics of an exemplary LWIR standard detector (dark blue line) and detector with anti-fringing technology (orange line)
Anti-fringing solutions
| Radiation decoherence | Reflectance reduction |
| Wedged window | AR coating on the window |
| Wedged cap | AR coating on the active structure |
| Modification of the internal structure |
Examples of infrared detectors with anti-fringing solution:
Author: Justyna Chrzanowska-Giżyńska PhD Senior Optical & Process Engineer, VIGO Photonics
Q&A Section
Question 1: What is the etalon effect (fringing) in infrared detectors?
Answer: Etalon effect (fringing) is a phenomenon that appears as signal fluctuations. It results from the interference of radiation that undergoes multiple reflections with the parallel optical components, which act as a Fabry-Perot ethalon.
Question 2: Which detector components are most susceptible to etaloning?
Answer: The most critical components susceptible to etaloning are the detector window and the chip (active structure) itself. This is because materials used in the infrared region exhibit high refractive indices, which generate strong reflections at the air interface.
Question 3: Why is optical fringing reduction so important in laser-based gas spectroscopy
Answer: Absorption spectroscopy (e.g., using QCL and ICL sources) relies on the precise measurement of light intensity passing through a gas. Sinusoidal fluctuations caused by optical fringing overlap with the gas absorption lines, drastically reducing detection sensitivity and accuracy, which ultimately prevents the detection of low concentrations (ppm/ppb).
Question 4: What determines the amplitude and period of the interference fringes (fringing)?
Answer: The period of the signal variations is closely linked to the optical path length (i.e., the component's thickness and its refractive index). On the other hand, the amplitude of the interference fringes (the depth of the modulation) depends on the intensities of the transmitted and reflected rays at the media interfaces.
Question 5: What are the main strategies for mitigating fringing in the detector architecture?
Answer: Strategies for fringing reduction can be divided into two main groups: radiation coherence reduction (e.g., by using wedged windows or wedged caps) and surface reflectance reduction (by depositing anti-reflection coatings).
References:
- K. Bogumil et al., J. Photoch. Photobiol. A: Chem. 157 (2003) 167–184
- P. Kluczynski et al., Appl. Phys. B 103 (2), 451-459 (2010)
- K. K. Sharma, Optics: Principles and Applications, Burlington, MA, USA: Academic Press, 2006