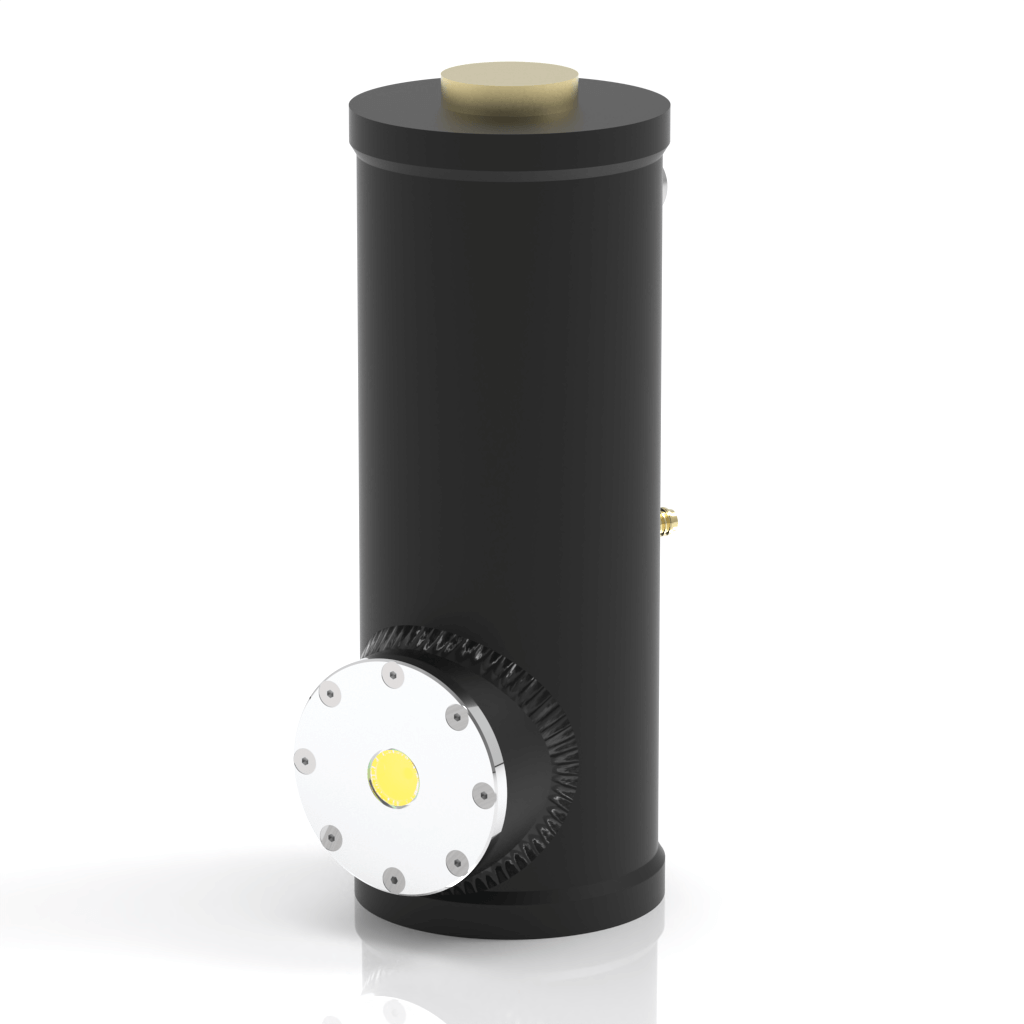
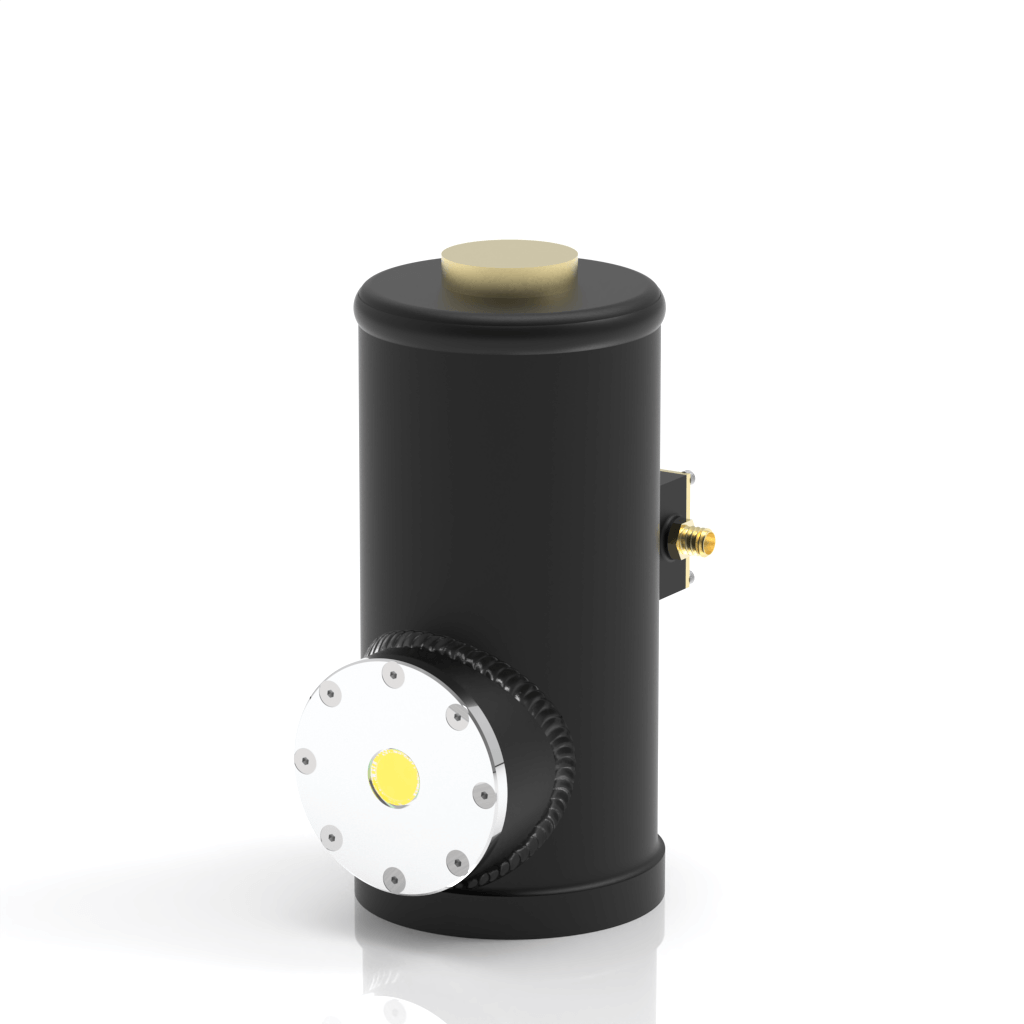
HgCdTe photoconductive infrared detector optimized for operation at 77 KPC-LN2-14-1x1-VFP-KR323-wZnSeAR-50
PC-LN2-14-1x1-VFP-KR323-NW-50 is a photoconductive IR detector based on HgCdTe heterostructures for optimal performance and stability. This detector is optimized for operation at cryogenic temperatures, typically at 77 K (liquid nitrogen temperature). Its 10% cut-off wavelength (λcut-off) is 17.4 µm and its active area (A) is 1 mm × 1 mm. The detector should operate in optimum bias current (Ib) and voltage readout mode. Performance at low frequencies is reduced due to 1/f noise. The detector is mounted in a Kadel KR323 dewar with a 3 deg. wedged zinc-selenide anti-reflection-coated window. This detector is widely used in demanding applications requiring exceptional sensitivity and a wide spectral range.
Features
Spectral range: over 17.0 µm
Large active area
Front-side illuminated
Active element material optimized for operation at 77 K
Possible assembly of temperature sensor
Active area dimension 0.25 mm × 0.25 mm available (on request)
Other acceptance angle values available (on request)
Applications
FTIR spectroscopy
Detector configuration
|
Detector symbol
|
PC-LN2-14-1x1-VFP-KR323-wZnSeAR-50 |
|
|
Detector type
|
photoconductive |
|
| Active element material | epitaxial HgCdTe heterostructure | |
| Cooling | LN2
(Tchip≅77K) |
|
| Temperature sensor | no | |
| Active area, A | 1 mm × 1 mm | |
| Optical immersion | no | |
| Package | VFP-KR323
(Tchip≅77K) |
|
| Acceptance angle, Φ | ~50 deg. | |
| Window | wZnSeAR
(3 deg. wedged zinc selenide, anti-refelection coating) |
|
Specification
(Tamb = 293 K, Tchip = 77 K, Ib = 15 mA)
| Parameter | Value |
Unit | |||
| Min. | Typ. | Max. | - | ||
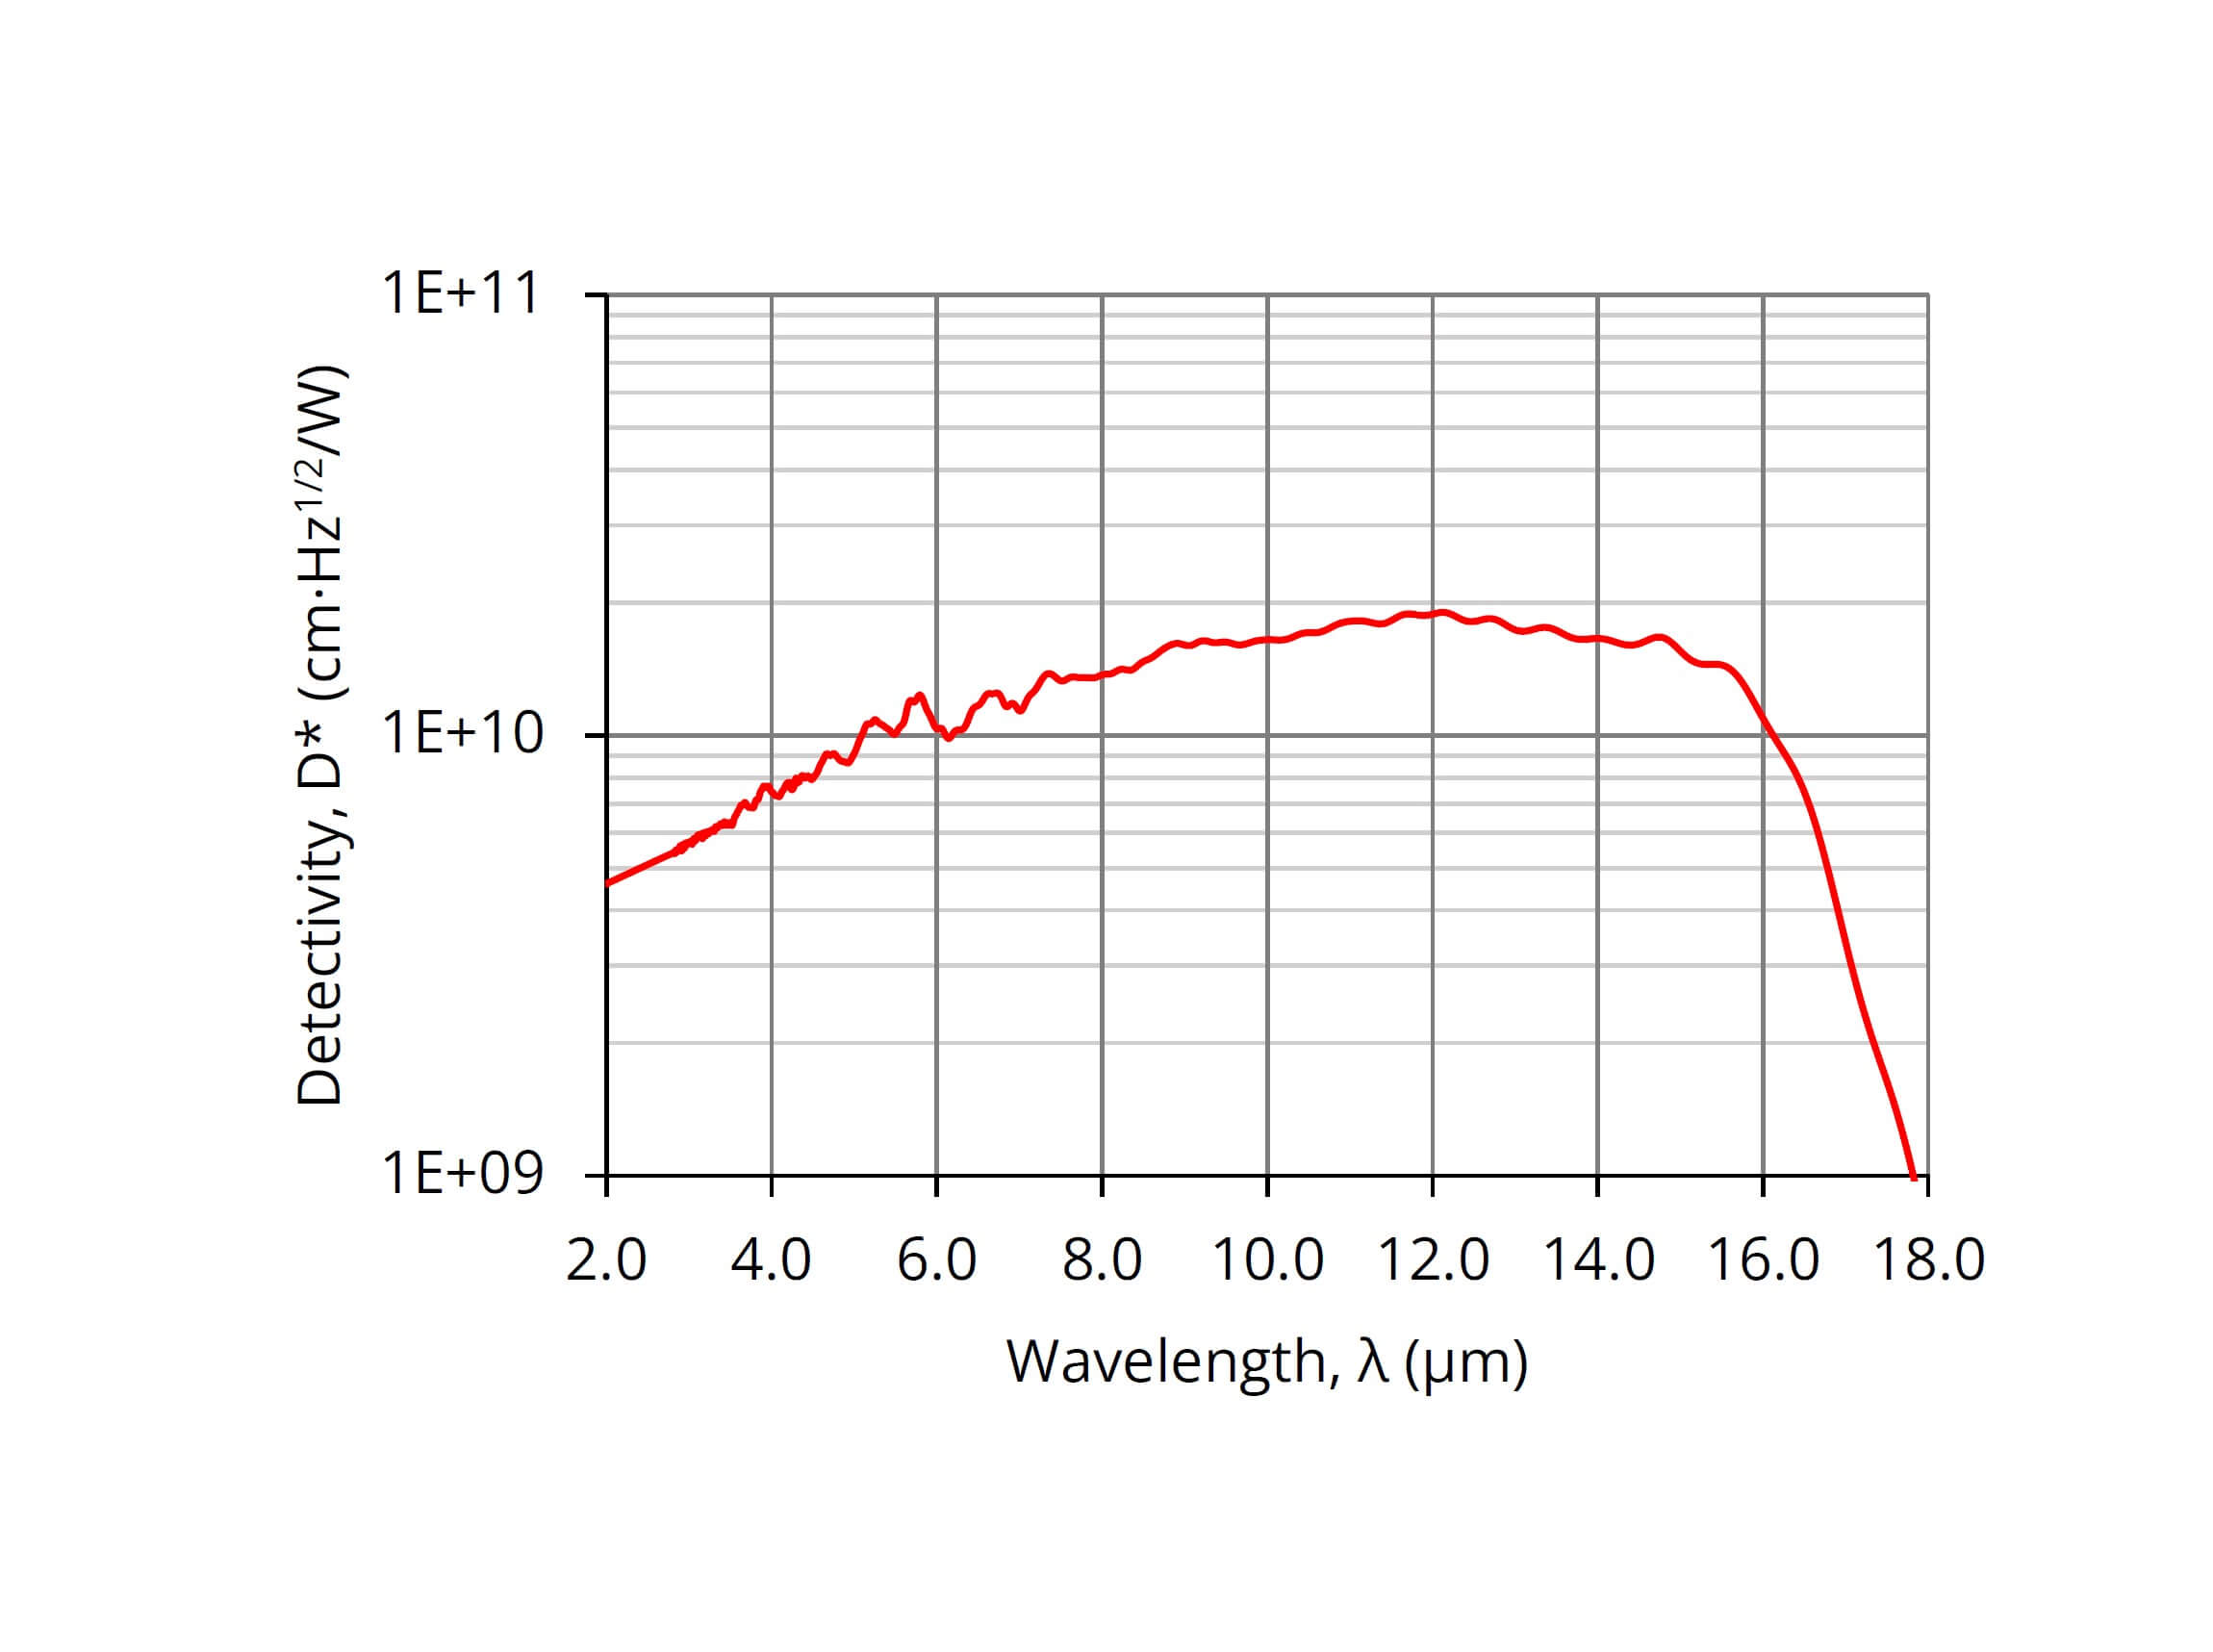
| Peak wavelength, λpeak | - | 12.1 | - | μm | |
| Cut-off wavelength, λcut-off (10%) | - | 17.4 | - | μm | |
| Detectivity, D* (λpeak, 20 kHz) | - | 1.9×10¹⁰ | - | cm⋅Hz1/2/W | |
| Voltage responsivity, Ri (λpeak) | - | 500 | - | V/W | |
| Resistance, R | - | 55 | - | Ω | |
| Bias current, Ib | - | 15 | - | mA | |
Spectral response
(Tamb = 293 K, Tchip = 77 K, Ib = 15 mA)
Access to file
Access to this file is limited. In order to download it, please provide all the information and submit the form.
Application notes
![]()
Temperature sensor characteristics


For more information, please contact us